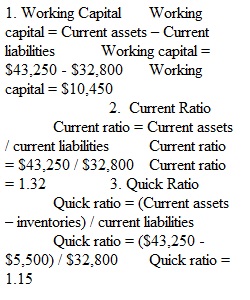
Q Ratio Analysis #1 and #2 Worksheet including Notes (Chapter 6) MGT 225 - Managerial Accounting Please Note: Problems 1-5 are part of Ratio Analysis #1 and Problems 6-10 are part of Ratio Analysis #2 1. Using the following data, compute and interpret working capital, current ratio, and quick ratio. 1. Working Capital 2. Current Ratio 3. Quick Ratio 2. Test Your Skills #2. Ericka Tuller is the manager of the Oasis restaurant. Ericka is compiling and analyzing a portion of her month?end income statement. She's most interested in the restaurant's prime cost percentage because, if prime cost is less than 60% for the month, Ericka will receive a $1000 bonus. Complete the portion of Ericka's income statement presented below. Round all percentages to the nearest hundredth's place (i.e., 40.25%). Then answer the questions that follow: Oasis Restaurant Partial P&L: Sales and Prime Cost This Month % SALES ?Food $81,500 80.85 ?Beverage $19,300 19.15 ??Total Sales 100.00 COST OF SALES ?Food $25,250 30.98 ?Beverage $4,200 21.76 ??Total Cost of Sales $29,450 LABOR ?Management $4,950 4.91 ?Staff $16,452 16.32 ?Employee Benefits 6.27 ??Total Labor Cost $27,727 PRIME COST 1. What was the amount of the operation's total sales for the month? 2. What was the operation's total cost of sales percentage for the month? 3. What was the amount spent by the operation for employee benefits this month? 4. What was the operation's total labor cost percentage for the month? 5. Should Ericka receive her $1000 bonus this month? 3.Test Your Skills #3. Gene Monteagudo operates The H?Town Eatery and Wine Bar. Gene took beginning and end of accounting period inventories in his operation and determined the following: Product Inventoried Beginning Inventory Ending Inventory Food $11,300 $8,700 Beverage $5,750 $6,250 Product Usage Cost of Food Used $122,000 Cost of Beverage Used $28,000 Help Gene better understand his operation's performance in the accounting period by completing the following worksheet he has developed, and then answer the questions that follow. AVERAGE INVENTORY Food Beverage INVENTORY TURNOVER Food Beverage 1. What was the average food inventory for Gene's operation? 2. What was the average beverage inventory for Gene's operation? 3. How many times did Gene turn his food inventory in the accounting period? 4. How many times did Gene turn his beverage inventory in the accounting period? 5. What would likely be the cause of the difference between Gene's food and beverage inventory turnovers? 4. Test Your Skills #4. The food and beverage department at the Fox Hills Country Club is an important part of the Club's overall profit structure. February food sales were $310,450 and beverage sales were $49,875. Because they represent such significant costs, Frankie Watson, the Club's Food and Beverage Director, keeps a careful watch on her food and beverage cost percentages. Using the following information for February that Frankie has recorded, help her complete her calculations and then answer the questions that follow. Fox Hills Country Club: February Food Sales $310,450 Beverage Sales $49,875 BEGINNING FOOD INVENTORY $5,410 Food Purchases $72,385 Ending Food Inventory $5,772 Transfers “Out of Kitchen” $922 Transfers “Into Kitchen” $1,346 Employee Meals $1,622 BEGINNING BEVERAGE INVENTORY $1,099 Beverage Purchases $12,588 Ending Beverage Inventory $1,244 Transfers “Out of Bar” $1,346 Transfers “Into Bar” $922 Complete the following: Beginning Food Inventory ? Purchases Food Available for Sale Ending Inventory Cost of Food Consumed Transfers Out Transfers In Employee Meals Cost of Food Sold Food Sales Food Cost % ? Complete the following: Beginning Beverage Inventory Purchases Beverage Available for Sale Ending Inventory Transfers Out Transfers In Cost of Beverage Sold Beverage Sales Beverage Cost % 1. What was the amount of Frankie's cost of food consumed in the month of February? 2. What was the amount of Frankie's cost of food sold in the month of February? 3. What was Frankie's food cost percentage in the month of February? 4. What was the amount of Frankie's cost of beverage sold in the month of February? 5. What was Frankie's beverage cost percentage in the month of February? 5.Test Your Skills #5. Elaine Ware owns her own non?franchised full?service hotel. Her competition is intense, so Elaine very carefully monitors the financial performance of her property. Ratios are essential to the management decisions she makes. Use the following information to calculate Elaine's operating ratios. The figures are based on one day's operation. HOTEL Total Rooms 225 Rooms Available for Sale 200 Rooms Occupied and Sold 140 Number of Guests 308 Housekeeping Costs $2,170 Rooms Revenue $17,500 Total Revenue from Hotel Guests $53,900 RESTAURANT Food Sales $2,700 Beverage Sales $900 Total Sales $3,600 Number of Guests (Covers) Sold 180 Number of Seats in the Restaurant 150 Available Seat Hours 1500 Labor Cost $1,260 Food ?Beginning Inventory $5,000 ?Purchases $500 ?Ending Inventory $4,565 ?Transfers Out $200 ?Transfers In $100 ?Employee Meals $25 Beverage ?Beginning Inventory $7,000 ?Purchases $250 ?Ending Inventory $7,188 ?Transfers Out $100 ?Transfer In $200 ? Calculate the following: HOTEL Occupancy Percentage Average Daily Rate (ADR) RevPAR Housekeeping CPOR RESTAURANT Check Average Seat Turnover RevPASH Cost of Food Sold Food Cost Percentage Cost of Beverage Sold Beverage Cost Percentage Labor Cost Percentage Please Note: Problems 1-5 are part of Ratio Analysis #1 and Problems 6-10 are part of Ratio Analysis #2 6.Test Your Skills #7 Carl, the owner of the Flagship Supper Club needs to produce and analyze this month's income statement. Using the following information, help Carl prepare his income statement. Round all percentages to the nearest hundredth's place (i.e., 35.25%). Then answer the questions that follow: Flagship Supper Club: This Month Total sales $1,550,000 Total cost of sales 31.0% Total labor $441,750 Employee benefits 6.5% Marketing costs 3.5% Flagship Supper Club Income Statement This Month % SALES ?Food 74.00 ?Beverage ??Total Sales 100.0 COST OF SALES ?Food ?Beverages $105,000 ??Total Cost of Sales LABOR ?Management ?Staff $214,500 ?Employee Benefits ??Total Labor PRIME COST OTHER CONTROLLABLE EXPENSES ?Direct Operating Expenses $116,669 ?Music and Entertainment $2,767 ?Marketing 3.50 ?Utilities $28,555 ?Administrative and General Expenses $54,750 ?Repairs and Maintenance $41,510 ??Total Other Controllable Expenses CONTROLLABLE INCOME NON?CONTROLLABLE EXPENSES ?Occupancy Costs $96,000 6.19 ?Equipment Leases $1,500 0.10 ?Depreciation and Amortization $49,812 3.21 ??Total Non?Controllable Expenses $147,312 9.50 RESTAURANT OPERATING INCOME Interest Expense $24,000 1.55 INCOME BEFORE INCOME TAXES Income Taxes 3.00 NET INCOME 1. What was the amount of the operation's beverage sales for the month? 2. What was the operation's cost of sales: food percentage for the month? 3. What was the total dollar amount spent on management for the month? 4. What was the operation's labor cost percentage for the month greater than or less than 30%? 5. What was the operation's prime cost for the month? 6. What was the operation's prime cost percentage for the month? 7. What was the amount spent on total other controllable expenses? 8. What was the operation's controllable income percentage? 9. What was the restaurant operating income percentage for the month? 10. What was the amount of the operation's net income for the month in dollars? In percent? Dopson, Lea R., David Hayes. Managerial Accounting for the Hospitality Industry, 2nd Edition. Wiley, 2016-11-28. VitalBook file. 7.Rachel's Restaurant Balance Sheet December 31 Last Year Versus This Year. 2015 2016 ASSETS Current Assets Cash 63,049 57,317 Marketable Securities 104,615 130,769 Net Receivables 64,000 80,000 Inventories 48,363 34,545 Total Current Assets 280,027 302,631 Investments 323,488 248,837 Property and Equipment Land 206,053 206,053 Building 418,665 418,665 Furnishings and Equipment 267,223 205,556 Less Accumulated Depreciation 142,710 135,429 Net Property and Equipment 749,231 694,845 Other Assets 12,651 15,814 TOTAL ASSETS 1,365,397 1,262,127 LIABILITIES AND OWNERS’ EQUITY Current Liabilities Accounts Payable 253,354 142,439 Notes Payable 38,286 31,905 Other Current Liabilities 192,279 147,907 Total Current Liabilities 483,919 322,251 Long-Term Liabilities Long-Term Debt 102,560 218,272 Total Liabilities 586,479 540,523 Owners’ Equity Common Stock 102,631 78,947 Paid in Capital 421,621 324,324 Retained Earnings 254,666 318,333 Total Owners’ Equity 778,918 721,604 TOTAL LIABILITIES AND OWNERS’ EQUITY 1,365,397 1,262,127 Calculate the following ratios and interpret for each year. 1. Solvency Ratio (Total Assets to Total Liabilities) 2. Debt to Equity (Total Liabilities to Total Equity) 3. Debt to Total Assets (Total Liabilities to Total Assets) 8. Ratio Interpretation and Bench Marking Exercise At year end, a 150 seat TSR generated the following financial data, ratios, etc. from their accounting system. Determine if the results are positive/negative for the business over the three accounting periods. How do these results compare to either benchmark or industry data? Use the Restaurant Benchmarking document and the Notes section of this worksheet to assist in interpreting the ratios. 9.Hyde Park Café - Partial Balance Sheet 12/31/18 12/31/19 Current Assets Cash $23,500 $29,200 Credit Card Receivable $3,252 $5,600 Accounts Receivable $2,500 $4,525 Marketable Securities $1,000 $8,000 Inventories $7,500 $8,000 Prepaid Expenses $1,200 $2,300 Total Current Assets $38,952 $57,625 Total Assets $198,630 $193,592 Current Liabilities Accounts Payable $3,550 $6,200 Accrued Expenses Payable $1,000 $1,500 Taxes Payable $5,900 $7,200 Interest Payable $1,200 $1,900 Current Mortgage Payable $11,200 $13,010 Total Current Liabilities $22,850 $29,810 Total Liabilities $222,113 $188,243 Calculate each ratio for both 2018 and 2019. Working Capital Current Ratio Quick Ratio Total Assets to Total Liabilities What do each of the ratios mean? Is the ratio improving or not? What are the typical benchmarks? Comment on Each. 10.Dining Room at Hotel Hyde Park Comparative Income Statement Difference 2018 2019 $ % SALES Food 1,225,618 1,399,239 Beverage 322,649 342,528 Total Sales COST OF SALES Food 497,622 451,165 Beverages 102,370 126,849 Total Cost of Sales LABOR Management 109,262 119,913 Staff 228,277 271,206 Employee Benefits 138,828 167,720 Total Labor PRIME COST OTHER CONTROLLABLE EXPENSES Direct Operating Expenses 101,114 108,215 Music & Entertainment 3,228 5,436 Marketing 21,342 35,295 Utilities 93,314 103,413 Administrative & General Expenses 43,628 56,731 Repairs & Maintenance 38,429 33,366 Total Other Controllable Expenses CONTROLLABLE INCOME NON-CONTROLLABLE EXPENSES Occupancy Costs 118,000 120,000 Depreciation & Amortization 28,114 33,861 Total Non-Controllable Expenses RESTAURANT OPERATING INCOME Calculate each ratio (%) for both 2018 and 2019 and interpret in the space provided. 2018 2019 Food Cost Beverage Cost Labor Cost Prime Cost Income before Tax Comments:_________________________________________________________________________________________________________________________________________________________________________________________________________________________________________________________________________________________________________________________________________________________________________________________________________________________________________________________________________________________________________________________________________________________________________________________________________________________________________________________________________________________________________________________________________________________________________________________________________________________________________________________________________________________________________________________________________________________________________________________________________________________________________________________________________________________________________________________________________________________________________________________________________ Notes Suggestion: It is recommended to take notes on this worksheet. It is critical to understand what each of the ratios tell us, how to interpret them, and what is the industry average or typical benchmark. Many of these are indicated here, but the list is not comprehensive. The Industry Data noted is from The National Restaurant Association’s Restaurant Operations Report, 2016 Edition. The general “Full Service Operations (that serves alcohol) median with an Average Check (pp) under $18” was quoted unless otherwise indicated. This full report which is the most recent one is posted on Moodle as well as previous reports. The following Ratios will be covered in Class: ? Liquidity Ratios (Working Capital, Current Ratio, Quick Ratio) ? Solvency Ratios (Solvency Ratio, Debt to Equity, Debt to Total Assets) ? Activity Ratios (Inventory Turnover, Inventory Holding, Fixed Asset Turnover, Total Asset Turnover) ? Profitability Ratios (Profit Margin, Return on Assets, Return on Owners Equity) ? Hospitality Specific Ratios (Hotel = Occupancy Percent, Average Daily Rate, Revenue Generated Per Available Room, Cost Per Occupied Room, Restaurant = Cost of Sales – Food, Cost of Sales- Beverage, Food Cost Percent, Beverage Cost Percent, Labor Cost Percent, Average Check, Seat Turnover, Revenue Generated Per Available Seat Per Hour) Liquidity Ratios Liquidity Ratios are used to determine a company's ability to pay off its short-terms debts obligations. 1. Working Capital = Current Assets – Current Liabilities 2. Current Ratio = Current Assets / Current Liabilities Example: 200,000 / 100,000 =2 Therefore for every $2 of Current Assets there is $1 of Current Liabilities AKA: 2:1 ($2CA to $1 CL) 3. Acid Test (Quick Ratio)= Quick Assets / Current Liabilities Quick Assets = Cash + Receivables + Securities The Acid Test measures a company's ability to meet its short-term obligations using its most liquid assets. (Does not include prepaids or inventories) Similar to Current Ratio, but most liquid assets. Solvency Ratios Show company's ability to meet its overall debt obligations. 4. Solvency Ratio = Total Assets / Total Liabilities Example = 1,000,000 / 700,000 = 1.43 Therefore, there are $1.43 Total Assets to Every $1 of Total Liabilities 5. Debt to Equity = Total Liabilities / Total Equity Example = 300,000 / 500,000 = .6 Therefore there are $.60 of Liabilities to every $1 of Equity 6. Debt to Total Assets = Total Liabilities / Total Assets Example = 250,000 / 500,000 = .5 Therefore there are $.50 of Liabilities to every $1 of Total Assets Activity Ratios Activity and turnover ratios indicate how well managers are using and controlling assets. Management needs to identify the appropriate turnover ratios for the specific operation. Benchmarks can be considered, but depends on type of operation, menu concept, specific location, availability of product or other assets, and geographic location. 7. Inventory Turnover = COS for Period / Average Inventory for Period Example: Food Inventory: March 1 = $8000 Food Inventory: March 31 = $6000 FOOD COS for March = $55000 Average Inventory = ($8000+$6000) / 2 = $7000 Calculation = $55000 / $7000 = 7.8 Times Therefore, the food inventory turns over 7.8 times per month. 8. Inventory Holding = Average # of Days for Inventory to Turn Over OR the # Times Inventory = 0 = Operating Days in Period / Inventory Turn Over for Period Example = 31 / 7.8 = 3.97 Days Therefore, the food inventory turns over every 3.97 Days Profitability Ratios Profitability Ratios: show management's effectiveness in using resources during an operating period. 11. Profit Margin = Net Income / Total Revenue (Or Operating Income if you do not have Net Income) Restaurant Industry Data: Income before tax= 6.1% of sales 12. Return on Assets = Income (before interest and tax) / total average assets Total Assets Period 1 = $800,000 Total Assets Period 2 = $900,000 Calculation = ($800,000 + $900,000) / 2 = $850,000 Return on Assets = $95,000 / $850,000 = 11.2% 13. Return on Owner’s Equity = Net Income / Total Average Owner’s Equity Hospitality Specific Ratios 14. Occupancy % = Rooms Occupied Daily / #Rooms Available Daily (or for period) 15. ADR = Average Daily Rate = Daily Room Revenue / Rooms Occupied Daily (or for period) 16. REVPAR = Revenue Generated per Available Room = Daily Room Revenue / # Rooms Available (or for period) 17. Cost per Occupied Room = Cost for Rooms Department / Rooms Occupied Example = $9870 / 250 = $39.48 Therefore, that day it is estimated that the hotel’s average cost per room sold is $39.48 which would include guest room supplies, laundry services, housekeeping service, electricity, etc. 18. Cost of Sales (Food and Beverage) = Beginning Inventory Value + Purchases for the Period – Ending Inventory Value (Plus Transfers In, Minus Transfers Out, Minus Employee Benefits, Comps, Promotions, Etc.) 19. Food or Beverage Cost = Cost of Food or Beverage/Sales Revenue (Food or Beverage) Industry Data: 32.5% overall, (Median for all Full Service Establishments: Food =34.6% and Liquor COS = 23.8%, Beer COS = 28.4%, Wine COS = 30.5%) 20. Labor Cost= Salaries + Wages + Employee Benefits / Total Sales Revenue Industry Data: 32.5% for TSR and 27.5% for QSR Industry Data: Prime Costs = 66.7% 21. Average Check = Sales revenue from period / # covers by Meal Period, Day, Week, Month 22. Seat Turnover by Meal Period or Day = # Covers / # Seats Industry Data: 1-2.9 / Day 23. Revenue per Available Seat = Sales Revenue per Month / # Seats Industry Data: $8179 (annual) Identifies: overall performance, contribution margin, etc. Look at Example :REVPASH https://www.bu.edu/revpash/
View Related Questions